Filter your whole dashboard by any dimension
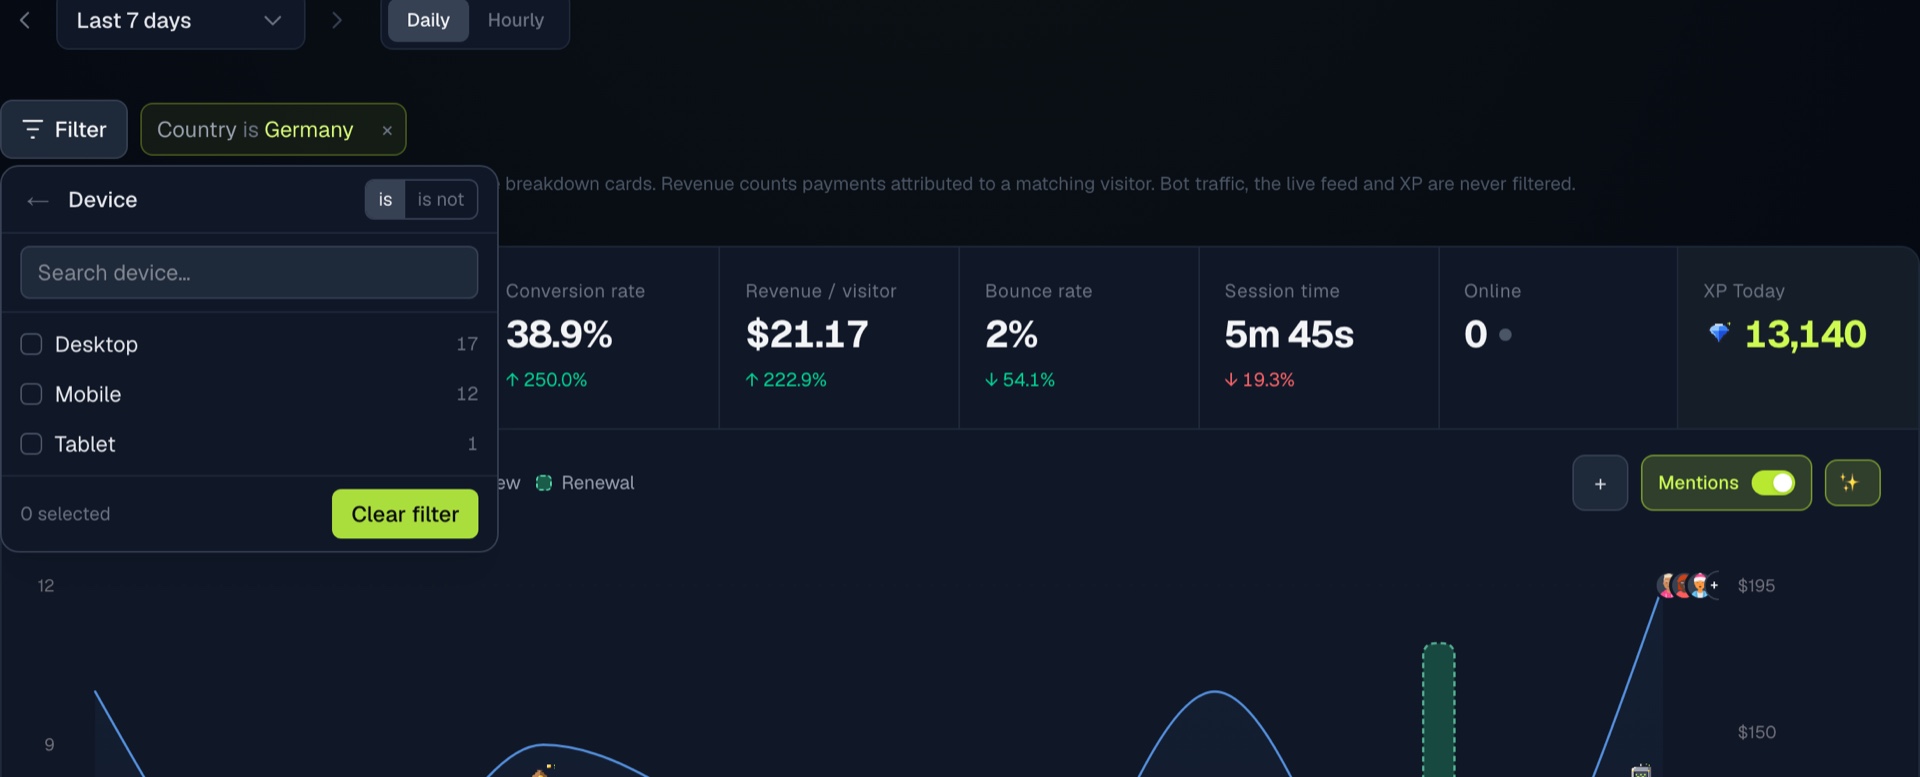
Until now your dashboard could only answer one question: how did the whole site do? If you wanted to know how visitors from Germany behaved, or whether your paid campaign converts better than organic search, you had to eyeball two cards and do the maths yourself.
Now you can just ask.
How it works
A Filter button sits above the stats strip. Pick a dimension, pick one or more values, apply. Fourteen dimensions are available, grouped the way you think about them:
- Source: channel, referrer, UTM source, UTM medium, campaign
- URL: hostname, page, entry page
- Location: country, city
- System: browser, OS, device
- Custom: goal
Everything below reacts at once. The stats strip, the traffic chart, goals, funnels, and all four breakdown cards recalculate for the visitors you selected.
You can also filter without opening the picker at all. Click any row in Top Pages, Channels, Devices or Countries and it becomes a filter. Click it again to drop it.
Each filter can be is or is not, and several values in one dimension are treated as "any of these". Stack filters across dimensions to narrow further, for example mobile visitors from Canada who completed your signup goal.
Shareable views
Active filters live in the page address, so a filtered dashboard is a link. Bookmark the view you check every morning, or paste it to a co-founder and they see exactly what you see.
Source filters keep whole visits rather than single hits, so bounce rate and session time stay meaningful when you slice by channel. Bot traffic, the live feed and your XP are never filtered.
Analytics that plays like a game. Free for 14 days, no card.
Start free trial →